Category:Correlation and combination datagraphics
Jump to navigation
Jump to search
Diagrams about correlations theorized to be interrelated or combining related subjects.
Often they may be useful more for finding causes such as via investigating best and worst cases or exceptions/outliers rather than determining whether or not a correlation exists and exploring the correlating factor.
Many files are still missing, add missing ones.
Subcategories
This category has the following 18 subcategories, out of 18 total.
Media in category "Correlation and combination datagraphics"
The following 38 files are in this category, out of 38 total.
-
.png/120px-Access-to-clean-fuels-and-technologies-for-cooking-vs-per-capita-energy-consumption_(OWID_0001).png)
-
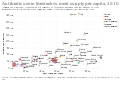 Antibiotic use in livestock vs. meat supply per capita, OWID.svg 850 × 600; 30 KB
-
 Cereal crop yield vs. fertilizer application, OWID.svg 850 × 600; 37 KB
-
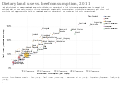
 Child mortality vs per capita total health expenditure, OWID.svg 850 × 600; 36 KB
-
%2C_OWID.svg/120px-Child_Mortality_vs._Health_Expenditure_(Gapminder)%2C_OWID.svg.png) Child Mortality vs. Health Expenditure (Gapminder), OWID.svg 850 × 600; 101 KB
Child Mortality vs. Health Expenditure (Gapminder), OWID.svg 850 × 600; 101 KB
-
 Children per woman vs. Human Development Index, OWID.svg 850 × 600; 35 KB
-
 Dietary land use vs. beef consumption, OWID.svg 850 × 600; 34 KB
-
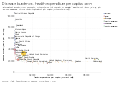 Disease burden vs. health expenditure per capita, OWID.svg 850 × 600; 34 KB
-
.jpg/120px-Environmental_impact_increases_with_proxy_measures_of_human_group_fitness_(this_is_a_problem).jpg)
-
 Extreme-poverty-vs-prevalence-of-underweight-children.png 3,400 × 2,400; 562 KB
-
.png/73px-Frauen_bewerben_sich_seltener_bei_Hochlohnfirmen_(Bewerbungsverhalten_von_Frauen_und_Männern).png)
-
 Healthspan, parental lifespan, and longevity are highly genetically correlated.webp 1,998 × 1,269; 87 KB
-
 Human Development Index vs. Corruption Perception Index, OWID.svg 850 × 600; 36 KB
-

-
 Human Development Index vs. Mean male height, OWID.svg 850 × 600; 33 KB
-
.png/120px-Life-satisfaction-vs-co-emissions-per-capita_(OWID_0575).png) Life-satisfaction-vs-co-emissions-per-capita (OWID 0575).png 850 × 600; 82 KB
Life-satisfaction-vs-co-emissions-per-capita (OWID 0575).png 850 × 600; 82 KB
-
 Measles-vaccine-coverage vs-measles-cases.png 3,400 × 2,400; 429 KB
-
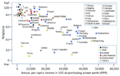
 Motor vehicles per 1000 inhabitants vs GDP per capita, OWID.svg 850 × 600; 35 KB
-

-
 Overlap between future population distribution and extreme heat.jpg 4,387 × 1,814; 1.97 MB
-
 Overlap between mining and biodiversity conservation.webp 980 × 581; 17 KB
-

-
 PartialCorrelationGeometrically.jpg 328 × 295; 8 KB
-
 Per-capita-co-emissions-vs-human-development-index.svg 850 × 696; 84 KB
-
.png/120px-Per-capita-consumption-based-co-emissions-vs-per-capita-energy-consumption_(OWID_0777).png)
-
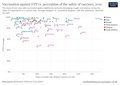 Perception-of-the-safety-of-vaccines-vs-vaccine-coverage.png 3,400 × 2,400; 589 KB
-
.png/120px-Prevalence-of-stunting-vs-improved-sanitation-facilities_(1).png) Prevalence-of-stunting-vs-improved-sanitation-facilities (1).png 3,400 × 2,400; 571 KB
Prevalence-of-stunting-vs-improved-sanitation-facilities (1).png 3,400 × 2,400; 571 KB
-

-

-
 Religion economy.png 670 × 426; 91 KB
-
 RnD-spending-and-religiosity-in-the-world.png 890 × 559; 49 KB
-
 Sibling-correlation-422.png 422 × 242; 4 KB
-
 Statin-use-vs-share-of-population-with-high-blood-pressure.png 3,400 × 3,865; 1.37 MB
-
 Suicide-vs-violent-deaths.png 2,947 × 2,865; 433 KB
-
 TFR HDI.PNG 331 × 338; 7 KB
-
 Vaccinationcoveragebyincome.png 3,400 × 2,400; 575 KB
-

-
.png)


,_OWID.svg)


.jpg)

.png)


.png)


.png)

.png)


